

Every mining engineer can tell you the target % solids for their grinding circuit. Most can tell you the target P80. Fewer can tell you the target viscosity — and most have never measured it. That is a problem, because viscosity is the variable that tells you whether your grinding circuit is actually achieving what the solids percentage implies.
% solids tells you how much solid is in the slurry. Viscosity tells you how hard it is to move. Those are not the same thing. A 65% solids slurry of coarse silica sand behaves very differently from a 65% solids slurry of fine iron ore. The silica sand may be Newtonian; the iron ore may be a non-Newtonian Bingham plastic. The density is the same. The viscosity is not.
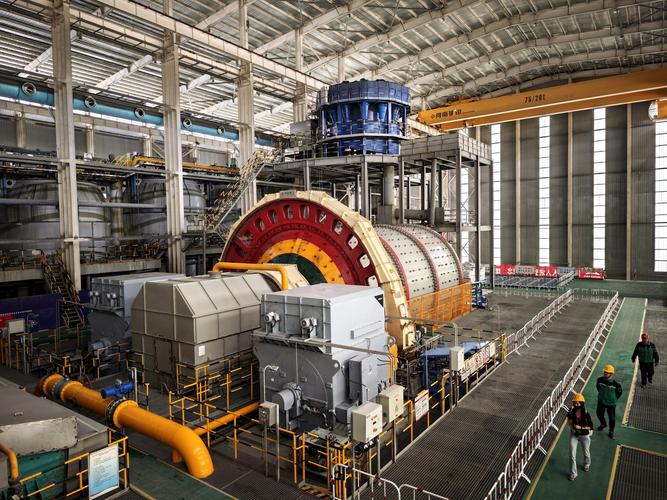
What slurry viscosity actually means in a grinding circuit
In a grinding circuit, slurry viscosity affects four things simultaneously:
Ball mill grinding efficiency. The slurry viscosity in the mill determines how the balls fall. In a low-viscosity slurry, the balls hit the ore with full impact. In a high-viscosity slurry, the fluid dampens the impact and the grinding energy per tonne of ore drops. Above a critical viscosity (typically 1,000–2,000 mPa·s depending on ball size), the mill power draw falls noticeably.
Pump head and power draw. The centrifugal pump that moves slurry around the circuit is sized for a specific slurry SG and viscosity. As viscosity increases, the pump curve shifts: the head at any given flow rate drops, and the power consumption rises. If viscosity is higher than the design assumption, the pump will operate off-design — either under-delivering or over-consuming.
Hydrocyclone classification efficiency. Above a certain viscosity threshold, the hydrocyclone classification efficiency drops because the particle settling velocity is reduced by the viscous drag. The result is the same as feeding too high a density: coarse particles report to the overflow.
Piping pressure drop. In the discharge line, the pressure drop is a function of both density and viscosity. High-viscosity slurries require larger pipe diameters or higher pump pressures to maintain the target flow rate. If you size the pipe for water and then run a high-viscosity slurry, the actual flow rate will be significantly lower than the design flow rate.
Why most mining slurries are not Newtonian
A Newtonian fluid has a viscosity that does not change with shear rate. Water is Newtonian. Air is Newtonian. Most thin slurries (below 20% solids) are approximately Newtonian.
Above 30–40% solids, most mineral slurries exhibit non-Newtonian behavior. The two types most relevant to grinding circuits:
Bingham plastic. The slurry behaves as a solid until the shear stress exceeds a yield stress threshold, then flows. Iron ore and nickel slurries often exhibit Bingham plastic behavior above 50% solids. The yield stress means that below a certain flow rate, the slurry does not move at all — it creates a stagnant layer in the pipe.
Shear-thinning (pseudoplastic). Viscosity decreases as shear rate increases. The slurry flows more easily when it is moving. Most mineral slurries are shear-thinning to some degree. This means the viscosity reading depends on the shear rate at which it is measured.
| What this means for viscosity measurement:
A single viscosity reading at one shear rate is not enough. You need to characterize the viscosity-shear rate relationship.
For process control, define the shear rate that corresponds to your process. Piping shear rate: typically 50–500 s⁻¹ Pump impeller shear rate: 500–10,000 s⁻¹ Mill internal shear rate: 10–100 s⁻¹ (laminar zone near balls)
Use the viscosity at the relevant shear rate, not the “static” viscosity. |
How to measure slurry viscosity online
There is no equivalent of the nuclear gauge for viscosity. Viscosity measurement in-process is harder than density measurement. The available options:
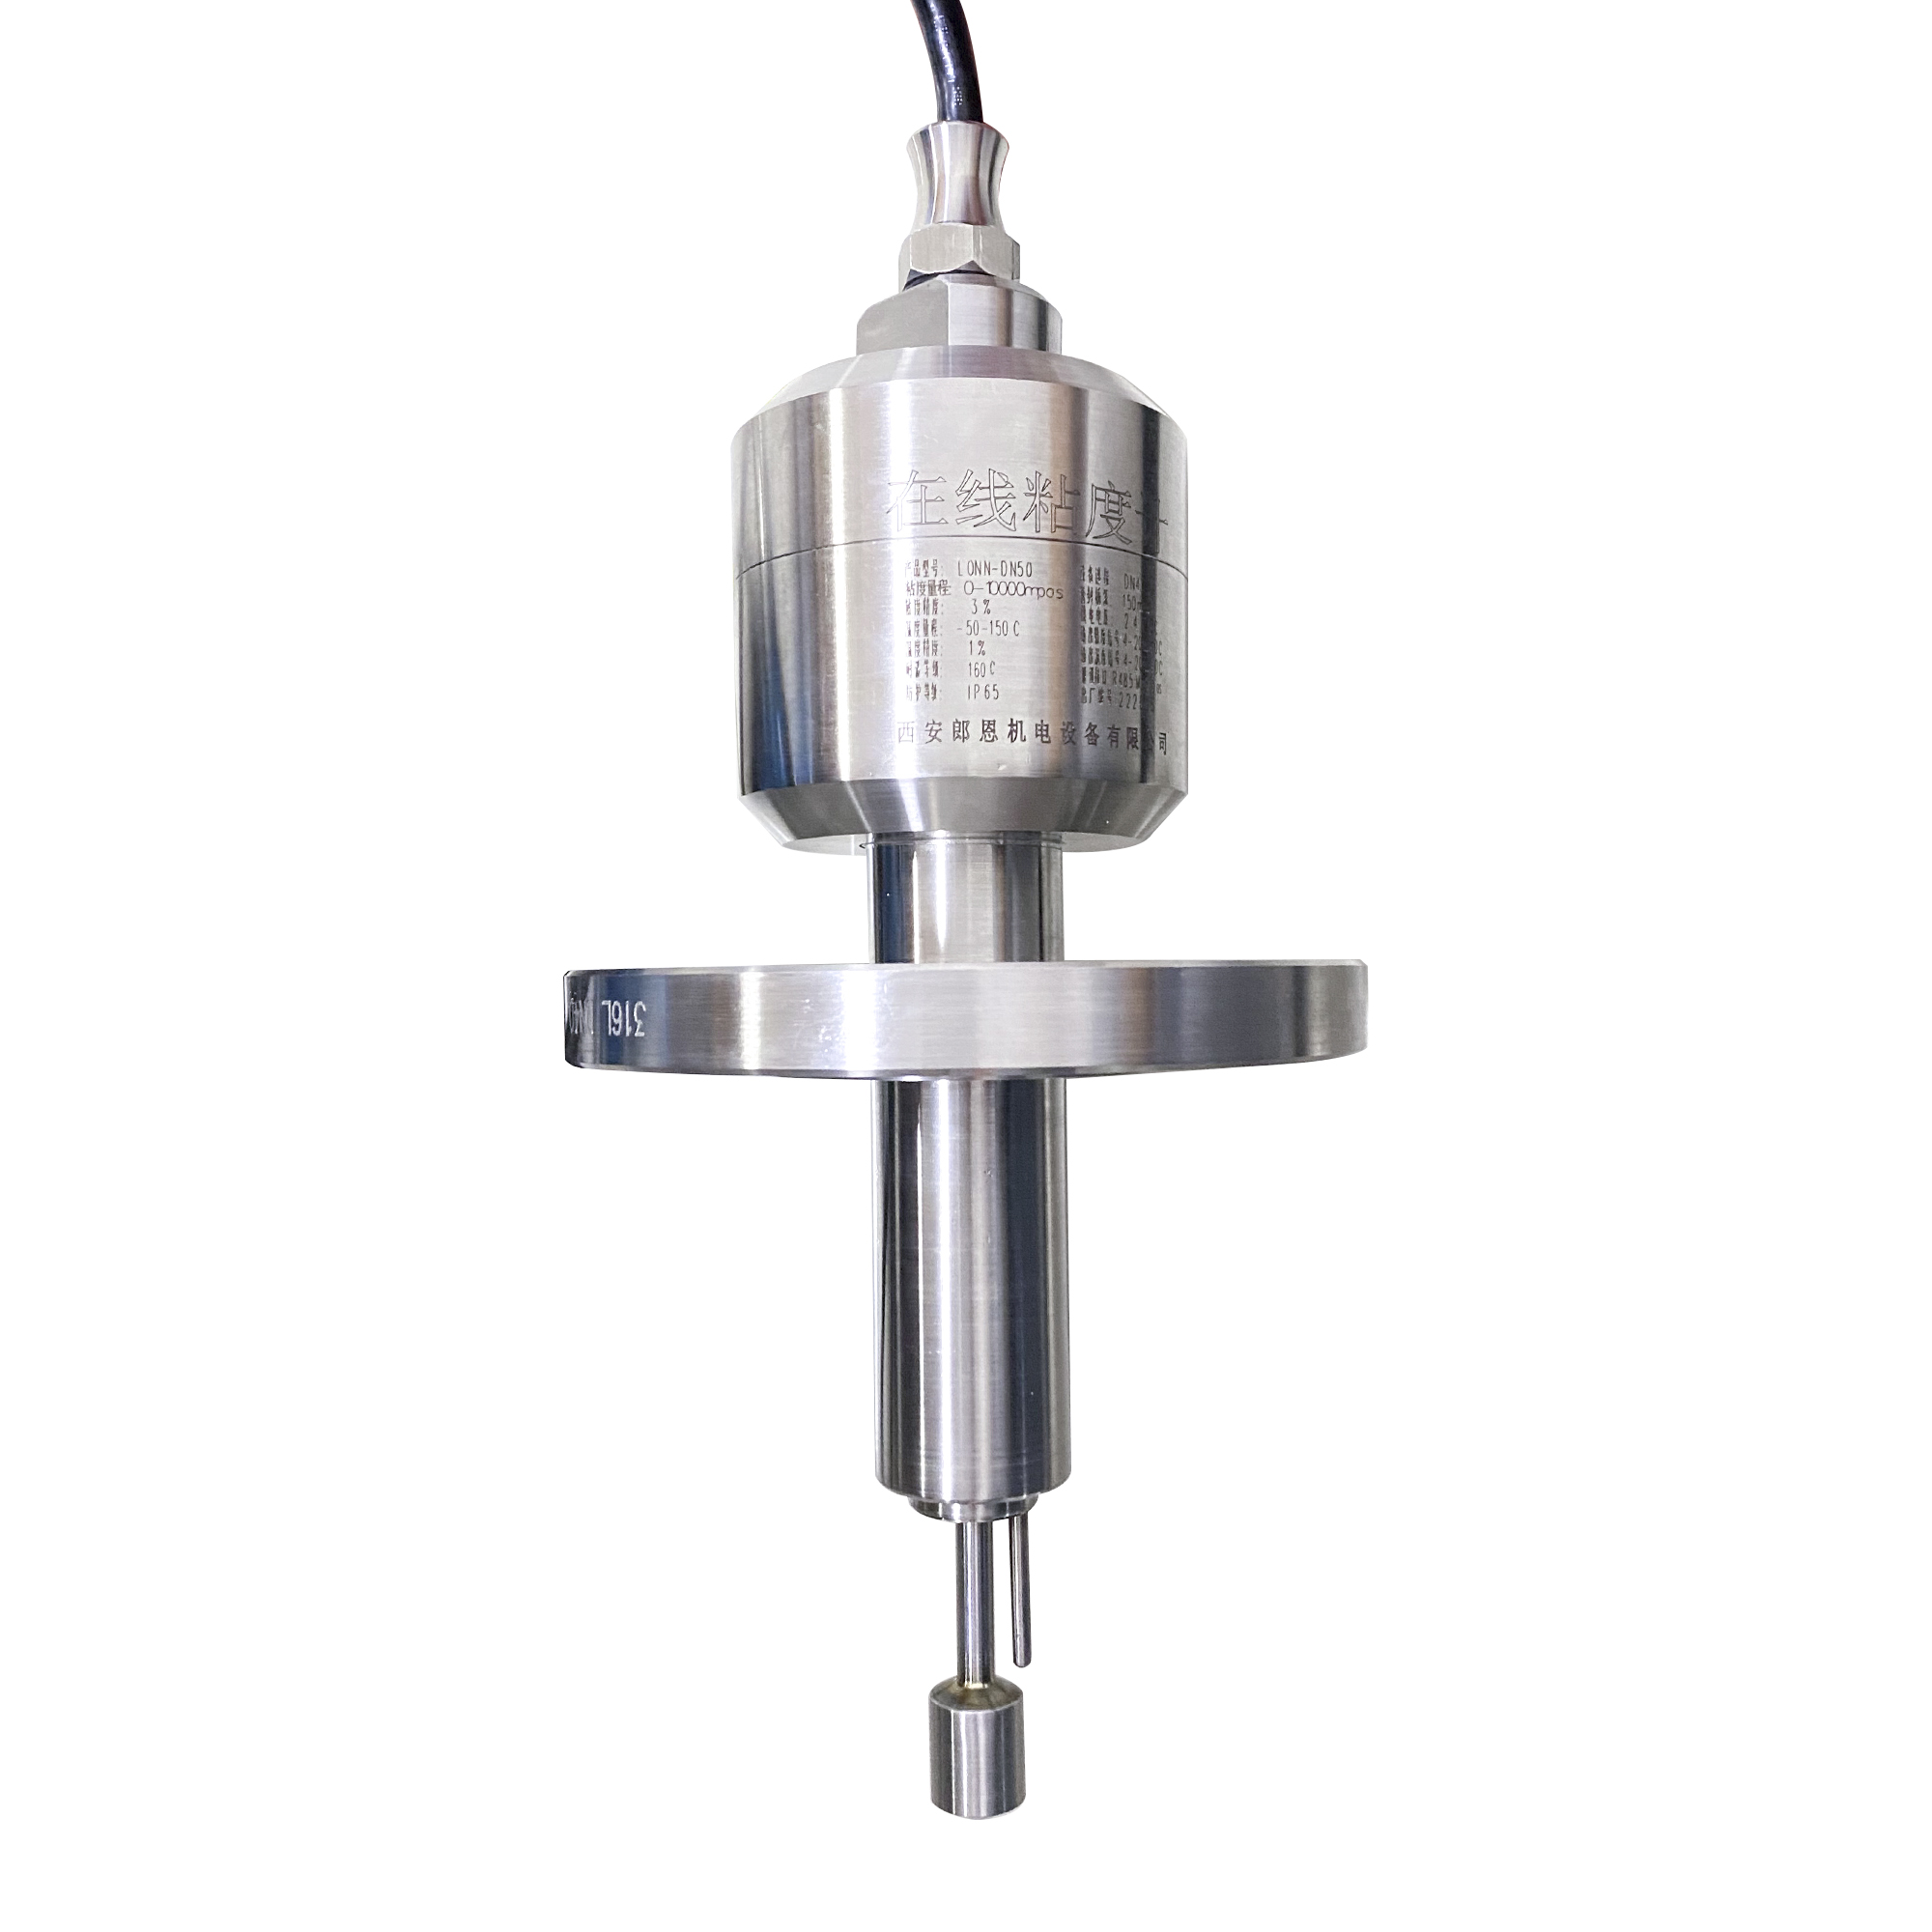
Vibrational viscometer (tuning fork or vibrating cylinder). Measures viscosity by damping the vibration of a probe immersed in the slurry. The damping is proportional to viscosity. This works reasonably well for Newtonian or mildly shear-thinning slurries up to about 5,000 mPa·s. It does not give you the shear rate dependency — it measures at one frequency, which corresponds to one effective shear rate.
Rotational viscometer (Couette or bob-and-cup). The shear rate is controlled by the rotation speed. This gives you the viscosity-shear rate curve directly. For non-Newtonian slurries, this is the more informative measurement. The drawback is that rotational viscometers are more prone to fouling in high-solids applications and are generally used in laboratory settings rather than inline.
Differential pressure flow measurement. If you measure the pressure drop across a known length of pipe, you can back-calculate the apparent viscosity. This is an indirect method but it gives a viscosity value at the actual process shear rate. It is most useful for monitoring changes in viscosity over time (e.g., detecting a shift in ore type) rather than for absolute accuracy.
Using viscosity data in circuit control
The most practical use of viscosity measurement in a grinding circuit is as a leading indicator of circuit behavior. Here is how it works:
As the ore feed changes (different rock type, different grindability), the % solids required to maintain the target throughput changes. If the ore becomes harder, the mill discharge may be coarser, and the slurry viscosity at the same % solids drops. The viscosity reading tells you this before the P80 lab result comes back.
Similarly, if the water addition to the sump is insufficient, the circuit operates at higher solids and higher viscosity. The viscosity reading can trigger an alarm before the mill power draw falls and the circuit goes off-spec.
The viscosity alarm threshold should be set based on the pump curve and the mill power draw relationship for your specific circuit. Work with the process engineer to define the viscosity at which pump performance degrades or mill efficiency drops. That is the alarm setpoint.
Field example: iron ore concentrator, Brazil
An iron ore concentrator in Minas Gerais was experiencing periodic drops in ball mill power draw that the operators could not explain. The % solids was holding steady. The feed rate was constant. The P80 was drifting higher, which they detected in the lab, but by the time the lab result came back the circuit had already been operating off-spec for several hours.
The root cause was a shift in ore type: the mine blends two ore bodies, and when the harder ore body was dominant, the mill discharge was coarser at the same % solids. The coarser discharge had a lower viscosity (fewer fine particles to create viscous drag), which reduced the slurry density around the balls and lowered the power draw.
They installed a vibrational viscometer on the mill discharge line. Within a week, they had established a correlation between the viscosity reading and the P80. The viscosity became the leading control variable. When the viscosity dropped below the established threshold, the operator increased the water addition to the sump, which raised the % solids and brought the viscosity back into the operating window. Mill power draw stabilized. P80 drift reduced by 80%.
What viscosity means for pump selection
Slurry pumps are selected using the pump performance curve and the system curve. The system curve is a function of the piping layout, the flow rate requirement, and the slurry properties. Viscosity is part of the friction losses in the system curve.
For Newtonian slurries, the viscosity correction to the pump curve is relatively straightforward. For Bingham plastic slurries, the calculation is more complex because the yield stress means there is a minimum velocity below which the slurry will not flow in the pipe (the depositing velocity). Below that velocity, a stationary bed forms and the pipe behaves as if its diameter has reduced.
The depositing velocity for a Bingham plastic slurry is roughly proportional to the yield stress divided by the viscosity. For iron ore slurries at 55–65% solids, the depositing velocity is typically 1.5–2.5 m/s. Design the pipe to maintain above this velocity, or expect the pipe to silt up.
LONNMETER instruments for mining slurry viscosity
The LONNMETER LONN-V100 inline vibrational viscometer covers the viscosity range relevant to grinding circuits (up to 5,000 mPa·s) with a response time under 2 seconds. The 4-20 mA output integrates with the plant DCS. The sensor is available in Hastelloy for abrasive slurries.
If you are considering adding viscosity measurement to a grinding circuit and want to establish the correlation between viscosity and circuit performance, the LONNMETER technical team can work with your process team to define the measurement location and the alarm thresholds.
uestions on mining slurry viscosity measurement
What viscosity range should I expect in a typical grinding circuit?
For most sulfide ore grinding circuits operating at 65–75% solids by weight, the apparent viscosity at pump shear rates (100–500 s⁻¹) ranges from 100 to 2,000 mPa·s. Iron ore circuits at similar solids loadings often run 200–3,000 mPa·s. The viscosity is not constant — it varies with ore type, grind size, and the clay or slimes content of the feed.
Can I use a vibrational viscometer in a non-Newtonian slurry?
Yes, but interpret the reading carefully. A vibrational viscometer measures at one effective shear rate (set by the vibration frequency). It gives you the viscosity at that shear rate, which is useful for monitoring changes over time. It does not give you the full viscosity-shear rate curve. For Bingham plastic slurries, the yield stress is not measured by a vibrational viscometer — only the plastic viscosity above the yield point.
What is the difference between apparent viscosity and plastic viscosity?
Apparent viscosity is the ratio of shear stress to shear rate at any given shear rate (used for non-Newtonian fluids). Plastic viscosity is the slope of the shear stress-shear rate curve above the yield stress (the Bingham plastic model: tau = tau_y + mu_p * gamma_dot). Plastic viscosity is a constant; apparent viscosity varies with shear rate. For process control, apparent viscosity at the process shear rate is the more useful number.
How does clay content affect slurry viscosity?
Clay minerals (smectite, illite, kaolin) have high surface area and tend to absorb water, forming gelatinous structures that dramatically increase viscosity at low concentrations. Even 2–5% clay by weight can double the slurry viscosity at 40% solids. In ore bodies with significant clay content, the viscosity-% solids relationship is highly non-linear and the Bingham plastic yield stress can become significant. Identify clay content in the ore characterization before sizing the pump and viscometer.
What is the depositing velocity and why does it matter?
The depositing velocity (also called the critical velocity or the minimum conveyance velocity) is the flow velocity below which solid particles begin to settle out of the slurry and form a stationary bed on the bottom of the pipe. For Bingham plastic slurries, it is roughly proportional to the yield stress divided by the plastic viscosity. Designing the pipe to maintain above the depositing velocity prevents pipe blockage and siltation. Below it, the effective pipe diameter shrinks and the pressure drop increases.
Post time: Aug-05-2026


