

The density meter is reading wrong. That is all you know. It could be a sensor problem, an installation problem, a calibration problem, or a process problem — and the reading does not tell you which one it is.
This guide is organized by symptom, not by component. When the meter is giving you a problem, start with the symptom that most closely matches what you are seeing. Each section walks through the likely causes in order of probability, then gives you a step-by-step check to confirm and resolve.
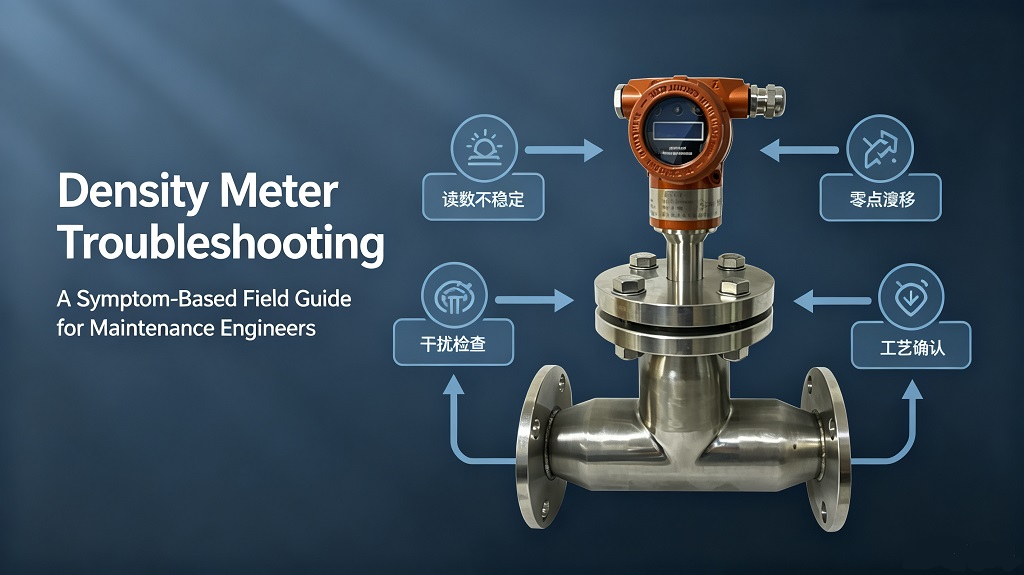
Symptom 1: Reading fluctuates more than ±0.005 g/cm³
This is the most common complaint and has the widest range of causes.
Cause 1: Gas bubbles in the process line (most common).
Gas bubbles amplify the apparent density reading because the sensor sees a two-phase fluid (liquid + gas) that has a lower average density than the liquid alone. Bubbles can come from a pump cavitating upstream, from dissolved gas coming out of solution when pressure drops, or from a leak drawing air into the suction line. The reading will jump erratically, usually to a higher value than the true liquid density.
Check: Is there a pump between the sampling point and the meter? Is the pump operating near its suction cutoff? Is there a pressure drop or valve immediately upstream of the meter? Install a deaeration chamber or a knockout pot upstream. Alternatively, move the sampling point to a location with higher pressure and lower velocity.
Cause 2: Two-phase flow (liquid + solid).
In slurry applications, unsteady solids concentration produces a fluctuating reading. The meter is reading the average density of a non-uniform mixture. If the solids are settling in the pipe, the density at the sensor changes depending on whether the sample is from the top or bottom of the pipe cross-section.
Check: Is the solids fraction stable upstream? Is the sampling line vertical or horizontal? Vertical sampling lines are better for slurries because they keep the solids suspended. Consider a bypass loop with a flow restrictor to maintain a consistent sampling velocity.
Cause 3: Vibration from adjacent equipment.
Mechanical vibration transmitted through the pipework can affect the sensor reading, particularly for tuning fork sensors. The fork tines respond to both process fluid density and external vibration.
Check: Is there a pump, agitator, or compressor nearby? Use pipe supports to isolate the sensor section from vibration sources. Some manufacturers offer vibration damping brackets for the sensor.
Cause 4: Temperature instability.
If the process temperature is changing rapidly (more than 1°C per minute), the temperature compensation in the meter may not be keeping up, producing a fluctuating density reading.
Check: Monitor the process temperature alongside the density reading. If the temperature is oscillating, the issue is upstream temperature control, not the meter. Consider adding a damping filter to the meter output to smooth the fluctuation.
| Fluctuating density reading: diagnostic checklist
☐ Gas bubbles: check pump suction, pressure at meter, look for upstream cavitation ☐ Two-phase flow: verify sampling line orientation (vertical > horizontal for slurries) ☐ Vibration: inspect adjacent equipment, check pipe supports near sensor ☐ Temperature: monitor T-signal stability, check if compensation time constant is adequate ☐ Wiring: check signal cable shielding and grounding
Quick test: Isolate the meter from the process with a shutoff valve. Fill with a known reference fluid. If the reading stabilizes, the problem is upstream process conditions, not the meter. |
Symptom 2: Reading is consistently off by more than 0.005 g/cm³
A consistently wrong reading means the meter is working, but the calibration or configuration is wrong.
Cause 1: Incorrect calibration zero or span.
The most common calibration error. The zero was set against the wrong reference fluid, or the span was set against a reference density that is incorrect. Even if the calibration was done correctly at the time, the sensor drift over months of operation can shift the reading by 0.001–0.003 g/cm³.
Check: Verify the calibration using a reference fluid of known density. Demineralized water at 20°C = 0.9982 g/cm³ is a good zero reference for most aqueous applications. For hydrocarbon applications, use a reference standard of known density in the operating range. If the reading is off by more than the specified accuracy, recalibrate.
Cause 2: Wrong expansion coefficient configured.
Every density meter applies a thermal expansion correction to the measured frequency to get the density at reference temperature. The expansion coefficient (α) must match the process fluid. If the coefficient is wrong, the temperature-corrected density will be wrong.
Check: Confirm the expansion coefficient is set for the correct fluid. Water α = 0.0002 g/cm³/°C. Hydrocarbons vary: gasoline α = 0.0012, fuel oil α = 0.0007. For chemical solutions, check the coefficient for the specific solute/solvent combination.
Cause 3: Sensor coating or fouling.
A coating on the sensor changes the effective mass of the vibrating element, which shifts the calibration. For tuning fork sensors, even a thin coating (0.1 mm) of polymer or scale can shift the reading by 0.002–0.005 g/cm³.
Check: Remove the sensor and inspect the fork tines. If there is visible coating, clean with the appropriate solvent. Do not use abrasive tools — they will damage the surface finish and affect future calibration. After cleaning, verify the calibration.
Cause 4: Reference temperature mismatch.
The meter is outputting density referenced to a different temperature than the lab measurement or the process specification. Common mismatch: meter configured for 15°C reference, lab measuring at 20°C.
Check: Confirm the reference temperature setting in the meter matches the reference temperature of your process specification. ISO and API standards specify different reference temperatures: ISO specifies 20°C for general use, API specifies 15°C for petroleum products.
Symptom 3: No output signal or zero reading
Cause 1: Power supply failure.
No power = no output. Check the supply voltage at the meter terminals. For 4-20 mA loop-powered meters, check the loop voltage. Most loop-powered instruments require at least 12 V at the meter terminals to operate.
Cause 2: Broken or loose wiring.
Check all connections at the meter and at the DCS/PLC terminal block. Look for corrosion, broken conductors, and loose screws. On 4-20 mA loop instruments, check the loop resistance.
Cause 3: Sensor failure.
For tuning fork sensors: check the resonance frequency in the configuration software. A tuning fork sensor with a broken tine or a cracked crystal will show a frequency outside the normal range or no frequency at all. For Coriolis meters: check the zero-offset in the diagnostics. A large offset (>50 Hz for most Coriolis instruments) indicates a sensor or electronics problem.
Cause 4: Sensor blocked or filled with solid material.
If the sensor cavity is blocked by settled solids, the fork tines cannot vibrate and the meter shows a fault condition or a stuck reading. This is common in gravity-fed bypass loops where the flow stops when the pump is off.
| No output: emergency check sequence
Step 1: Check power supply voltage at meter terminals (≥12 V for 4-20mA loop) Step 2: Check wiring continuity and ground connections Step 3: Check loop resistance (max loop resistance = supply V − 12 V / 0.02 A) Step 4: Check sensor diagnostics (frequency, zero offset) if accessible Step 5: Check for sensor blockage or solid buildup in the sensor cavity
If sensor failure is confirmed: isolate from process, tag out, replace sensor. Do not apply power to a suspect sensor in a hazardous area until inspection is complete. |
Symptom 4: Density changes are not reflected in the reading
Cause 1: Excessive damping in the meter configuration.
Most meters have a configurable damping time constant. A long damping time smooths out noise but also delays the response to actual process changes. If the damping is set to 60 seconds and the process changes in 30 seconds, the meter will never catch up.
Check: Reduce the damping time constant in the meter configuration. Start at 5 seconds and increase until the reading is stable without lagging the process.
Cause 2: Dead leg or stagnant sample in the bypass loop.
If the bypass loop has a dead leg (a section of pipe where fluid does not flow), the sample reaching the sensor is not representative of the current process fluid.
Check: Verify the bypass flow rate. Ensure the bypass loop is self-draining and there are no dead legs. The sensor should be in the flowing section, not the drain.
Cause 3: Slow temperature equilibration.
If the process temperature changes, the sensor takes time to reach thermal equilibrium with the fluid. The temperature sensor in the meter is usually faster than the density measurement, but if the meter body has high thermal mass, the temperature reading can lag.
Preventive maintenance schedule
| Interval | Task | What to Look For |
| Monthly | Verify output signal against expected range | 4-20 mA within range, no fault status |
| Monthly | Compare meter reading to lab sample | Drift >0.002 g/cm³ = recalibrate |
| Quarterly | Inspect and clean sensor | Coating, fouling, mechanical damage |
| Quarterly | Verify calibration with reference fluid | Known reference density ± instrument accuracy |
| Annually | Full calibration and configuration audit | Zero, span, expansion coefficient, reference temp, output range |
| Annually | Hazardous area certification check | Ex certification validity, seal integrity, cable entries |
Common questions on density meter troubleshooting
How often should I recalibrate the density meter?
At minimum annually. In high-accuracy applications (±0.001 g/cm³), recalibrate quarterly and verify monthly against a reference sample. In abrasive or corrosive service, recalibrate whenever the sensor is cleaned or after a significant process upset. The calibration interval should be based on the drift observed in service, not an arbitrary calendar schedule.
Can I clean the tuning fork sensor with high-pressure water?
No. High-pressure water can bend the fork tines, especially if the tines are close together. Use low-pressure flushing with the appropriate chemical cleaning agent. If the coating is stubborn, soak the sensor in cleaning solution rather than using mechanical force. After cleaning, verify the zero and span calibration.
Why does the density reading drift more in some fluids than others?
Fluids that leave coatings (polymers, waxes, scale-forming solutions, high-viscosity fluids) cause faster drift because they deposit on the sensor even at low concentrations. If the fluid is known to coat, reduce the calibration interval and consider a sensor with a non-stick coating (PTFE) or a nuclear gauge if contact measurement is causing persistent problems.
What is the difference between damping and averaging?
Damping applies a low-pass filter to the output signal, slowing the response to smooth out noise. Averaging takes the mean of the last N readings. Both reduce noise but both also delay response to genuine process changes. Use the minimum damping/averaging that gives a stable reading. If you need a stable output for control but a faster response for alarm, use the damping for the control output and a separate undamped output for the alarm.
How do I know if the issue is the meter or the process?
Isolate the meter from the process using shutoff valves. Flush with a known reference fluid (water at 20°C for aqueous processes). If the meter reads correctly in the reference fluid, the problem is upstream process conditions (bubbles, two-phase flow, temperature gradients). If the meter still reads incorrectly with the reference fluid, the problem is the meter (calibration, coating, sensor failure).
Post time: Aug-17-2026


