

The production of polyurethane (PU) coatings and adhesives is a complex, multi-stage process governed by sensitive chemical reactions. While the demand for these materials continues to grow across industries, their manufacturing presents a series of core challenges that directly impact product quality, production efficiency, and overall profitability. A thorough understanding of these foundational issues is critical for developing a strategic and practical roadmap for improvement.
1.1. Inherent Chemical Complexity and Variability: The Fast-Curing Challenge
Polyurethane production is a polyaddition reaction between polyols and isocyanates, a process that is often rapid and highly exothermic. The speed and heat generated by this reaction make precise control exceptionally difficult. The inherent complexity is further compounded by the sensitivity of the reaction to external factors such as temperature, humidity, and the presence of catalysts. Small, uncontrolled fluctuations in these environmental conditions or material inputs can lead to significant variations in the final product's properties, including its curing time and physical performance.
A fundamental challenge in this context is the "short pot life" of many fast-curing PU systems. The time scales of gas production and PU crosslinking are often too brief to be compatible with traditional characterization methods. This is a central engineering and economic problem. Traditional quality control (QC) procedures, which involve taking a sample from the reactor and transporting it to a laboratory for analysis, are inherently flawed. The process of lab titration is slow, and critically, the sample's chemical properties begin to change the moment it is removed from the reactor and exposed to ambient conditions. This latency means that the lab results are a post-mortem analysis of a batch that has already been produced. The data is not only non-actionable, arriving too late to allow for intervention, but also potentially inaccurate, as it no longer represents the state of the material inside the production vessel. This fundamental incompatibility of traditional, lag-based quality control with the rapid kinetics of PU chemistry is the primary problem that advanced monitoring and modeling must address.

1.2. Root Causes of Batch Inconsistency and Defect Formation
Batch-to-batch inconsistency and the formation of defects are not random occurrences but the direct consequence of a lack of precision in controlling critical process parameters. The final product is highly sensitive to the component ratio, the mixing technique, and the temperature profile throughout the process. An improper mix, for instance, can lead to unevenly dispersed fillers or hardeners, causing "built-in stresses" and defects within the final product.
The precision of raw material input, particularly the molar ratio of isocyanate (NCO) to hydroxyl (OH) groups, is paramount for maintaining quality continuity. This NCO/OH ratio is a direct determinant of the final product's properties; as the ratio increases, so do key physical properties such as tensile strength, modulus, and hardness. The ratio also affects the material's viscosity and curing behavior. Other critical process conditions, such as the heat profile, are equally important. Insufficient or non-uniform heating can cause uneven curing and localized shrinkage, while volatile components can flash off, leading to bubbles and blemishes.
A detailed analysis of defect root causes reveals that a single sensor or parameter is often insufficient for accurate diagnosis. A problem like "No gel or will not cure" could be caused by an incorrect mix ratio, insufficient heat, or improper mixing. These causes are often interrelated. For example, a temperature that is too low will slow the curing process and can be mistakenly diagnosed as a problem with the material ratio. To truly understand and address the root cause, it is necessary to measure multiple parameters simultaneously. This requires a comprehensive sensor suite that can correlate real-time data from various sources to isolate the true causal factor from the resulting symptoms, a task beyond the scope of traditional, single-point monitoring.
1.3. Economic and Environmental Impact of Inefficiencies
The technical challenges in polyurethane production have direct and significant economic and environmental repercussions. High-quality raw materials, such as polyols and isocyanates, are expensive, and their prices are subject to fluctuations due to supply chain discontinuities, dependence on crude oil, and global demand. When a batch of products fails to meet quality specifications, the wasted raw materials represent a direct financial loss that exacerbates these high costs. Unplanned downtime, resulting from the need to troubleshoot and correct process deviations, is another major financial drain.
On the environmental front, the inefficiencies and waste inherent in traditional production methods are a significant concern. Many conventional polyurethane coatings are solvent-based and contribute to air pollution through Volatile Organic Compound (VOC) emissions. While industries are increasingly adopting water-based and low-VOC alternatives, these often fail to match the performance of their solvent-based counterparts in high-performance applications. Moreover, the raw materials used in traditional PU production are petroleum-based, non-renewable, and non-biodegradable. Defective products that end up as waste can release harmful chemicals into the environment as they break down over a period of up to 200 years.
The convergence of these economic and environmental factors creates a powerful business case for digitalization. By implementing the solutions proposed in this report, a company can concurrently reduce costs, improve profitability, and enhance its sustainability profile. Addressing the technical problem of batch inconsistency directly mitigates the financial and environmental problems, transforming a technical upgrade into a strategic business imperative.

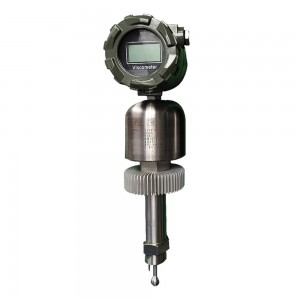
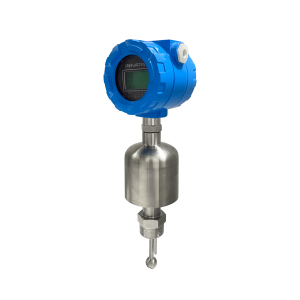
Inline monitoring of free isocyanate content in polyurethane
II. Advanced Real-Time Monitoring Technologies
To overcome the inherent challenges of PU production, a shift from traditional lab-based testing to real-time, inline monitoring is essential. This new paradigm relies on a suite of advanced sensor technologies that can provide continuous, actionable data on critical process parameters.
2.1. Inline Rheological Monitoring
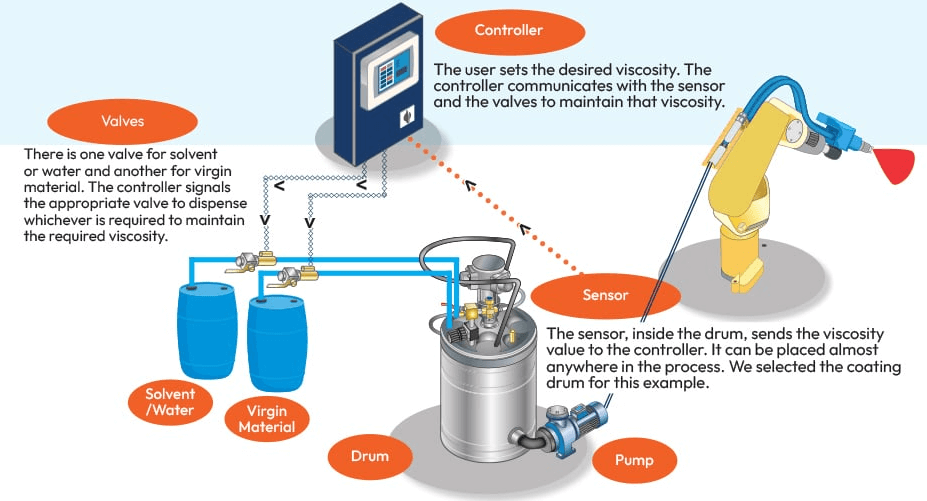
Rheological properties such as viscosity and density are fundamental to the success of a polyurethane reaction. They are not merely physical characteristics but serve as direct indicators of the polymerization and crosslinking processes. Real-time monitoring of these properties is accomplished using inline process viscometers and density meters.
Instruments such as the Lonnmeter Polymer Viscometer and Viscosity Processor are designed for direct insertion into pipelines and reactors, allowing for continuous measurement of a fluid's viscosity, density, and temperature. These devices operate on principles such as vibrating fork technology, which is robust, requires no moving parts, and is insensitive to external vibrations and flow variations. This capability provides a non-destructive, real-time method to track the polymerization process. The NCO/OH molar ratio and the formation of polar bonds, for instance, directly affect viscosity, making it a reliable proxy for the reaction's progress. By ensuring the viscosity remains within a specified range, a production team can confirm that the reaction is proceeding as desired and control the addition of chain extenders to achieve the target molecular weight and crosslinking. This tight, real-time control improves product quality and reduces waste by preventing the production of out-of-spec batches.
2.2. Spectroscopic Analysis for Chemical Composition
While rheological properties indicate the physical state of the material, real-time spectroscopic analysis provides a deeper, chemical-level understanding of the reaction. Near-Infrared (NIR) spectroscopy is a superior method for continuously monitoring the core reaction by quantifying the concentration of isocyanate (%NCO) and hydroxyl groups.
This method represents a significant advancement over traditional laboratory titration, which is slow and uses chemicals that require proper disposal. The ability of a real-time NIR system to monitor multiple process points from a single analyzer provides a significant advantage in terms of efficiency and safety. The NCO/OH ratio is not just a process variable; it is a direct determinant of the final product's properties, including tensile strength, modulus, and hardness. By providing continuous, real-time data on this critical ratio, an NIR sensor allows for the proactive adjustment of material feed rates. This transforms the control process from a reactive, defect-driven approach to a proactive, quality-by-design strategy, where a precise NCO/OH ratio is maintained throughout the reaction to guarantee a high-quality outcome.
2.3. Dielectric Analysis (DEA) for Cure State Monitoring
Dielectric Analysis (DEA), also known as Dielectric Thermal Analysis (DETA), is a powerful technique for monitoring the "invisible in-mold curing" that is crucial for final product quality. It directly measures changes in a material’s viscosity and cure state by applying a sinusoidal voltage and measuring the resulting changes in the mobility of charge carriers (ions and dipoles). As a material cures, its viscosity increases dramatically, and the mobility of these charge carriers decreases, providing a direct, quantifiable measure of the cure's progress.
DEA can accurately determine the gel point and the end of the cure process, even for fast-curing systems. It offers a nuanced view that complements other technologies. While an inline viscometer measures the overall bulk viscosity of the material, a DEA sensor provides insight into the chemical-level progression of the crosslinking reaction. The combination of an inline viscometer (measuring the result of the cure) and a DEA sensor (measuring the progression of the cure) provides a comprehensive, two-tiered view of the process that enables highly precise control and diagnosis. DEA can also be used to monitor the effectiveness of various additives and fillers.
A comparison of these technologies highlights their complementary nature. No single sensor can provide a complete picture of the complex PU reaction. A holistic solution requires the integration of multiple sensors to monitor different physical and chemical properties simultaneously.
|
Parameter Monitored |
Technology Principle |
Primary Use Cases |
|
Viscosity, Temperature |
Vibrating Fork Viscometer |
Raw material QC, real-time reaction monitoring, end-point detection. |
|
%NCO, Hydroxyl Number |
Near-Infrared (NIR) Spectroscopy |
Real-time chemical composition monitoring, feed ratio control, catalyst optimization. |
|
Cure State, Gel Point |
Dielectric Analysis (DEA) |
In-mold cure monitoring, gelation time verification, additive effectiveness analysis. |
Table 2.1: Comparison of Advanced Inline Monitoring Technologies for PU Production
III. Quantitative Predictive Modeling Frameworks
The rich data streams from advanced monitoring technologies are a prerequisite for digitalization, but their full value is realized when they are used to build quantitative predictive models. These models translate raw data into actionable insights, enabling a deeper understanding of the process and a shift toward proactive optimization.
3.1. Chemorheological and Cure Kinetics Modeling
Simply collecting sensor data points is not sufficient for achieving true process control; the data must be used to build a model that explains the underlying behavior of the chemical reaction. Chemorheological and cure kinetics models link chemical conversion to physical changes, such as the increase in viscosity and gelation time. These models are particularly valuable for fast-curing systems, where a phenomenon's transient nature makes traditional analysis difficult.5
Isoconversional methods, also known as model-free approaches, can be applied to non-isothermal data to predict the reaction kinetics of fast-curing resins. Such models involve highly coupled thermo-chemo-rheological analysis, which means they consider the interplay of temperature, chemical composition, and material flow properties. By building a mathematical representation of the entire reaction, these models move beyond simple monitoring to provide true process understanding. They can predict how viscosity will change over time for a given temperature profile, or how a change in a catalyst will alter the reaction rate, providing a sophisticated tool for control and optimization.
3.2. Chemometric Analysis and Multivariate Regression
Polyurethane production is a multivariate process where multiple factors interact to determine the final product's quality. Traditional, single-factor experimentation is time-consuming and fails to capture the complex, nonlinear relationships between variables. Chemometric techniques, such as Partial Least Squares (PLS) regression and Response Surface Methodology (RSM), are designed to address this challenge.
Partial Least Squares (PLS) regression is a technique that is well-suited for the analysis of large, correlated datasets, such as those generated by a real-time NIR spectrometer. PLS reduces the problem from a large number of interrelated variables to a small number of extracted factors, making it excellent for predictive purposes. In the context of polyurethane production, PLS can be used to diagnose process problems and reveal how quality variables vary spatially within the product.
Response Surface Methodology (RSM) is a powerful mathematical and statistical method specifically for modeling and optimizing experimental conditions. RSM allows for the analysis of the combined effects of multiple factors—such as NCO/OH ratio, chain extension coefficient, and curing temperature—on a desired response variable like tensile strength. By strategically placing experimental points in critical regions, RSM can accurately characterize the underlying nonlinear relationships and interactive effects among factors. A study demonstrated the effectiveness of this approach, with a model predicting final properties with an impressive accuracy error of just 2.2%, providing a compelling validation of the methodology. The ability to map the entire "response surface" for a quality metric enables an engineer to identify the optimal combination of all factors simultaneously, leading to a superior solution.
3.3. Digital Twin of the Production Process
A digital twin is a dynamic, virtual replica of a physical asset, system, or process. In chemical manufacturing, this replica is powered by real-time data from IoT sensors and predictive models. It serves as a living, high-fidelity simulation of the production line. The true value of a digital twin lies in its ability to provide a low-risk environment for high-stakes optimization.
Polyurethane production is a costly process due to expensive raw materials and high energy consumption. Conducting physical experiments to optimize the process is therefore a high-risk, high-cost endeavor. A digital twin directly addresses this challenge by allowing engineers to run thousands of "what-if" scenarios on a virtual model without consuming any raw material or production time. This capability not only accelerates the time-to-market for new formulations but also significantly reduces the cost and risk of process optimization. Furthermore, digital twins can bridge the gap between new digital technologies and older, legacy systems by integrating real-time data from existing infrastructure, providing a unified digital environment without the need for extensive overhauls.
IV. AI/Machine Learning for Process Control and Anomaly Detection
Predictive models transform data into understanding, but artificial intelligence (AI) and machine learning (ML) take the next step: transforming understanding into autonomous action and intelligent control.
4.1. Anomaly and Fault Detection Systems
Traditional process control systems rely on static, hard-coded thresholds to trigger alarms. This approach is prone to errors, as it can fail to detect gradual deviations that remain within an acceptable range or can generate nuisance alarms that desensitize operators. AI-driven anomaly detection represents a significant paradigm shift. These systems are trained on historical data to learn the normal operating patterns of a process. They can then automatically identify and flag any deviations from this learned pattern, even if a parameter has not yet crossed a static threshold.
For example, a gradual but consistent increase in viscosity over a specific time frame, though still within the acceptable range, might be a harbinger of an impending problem that a traditional system would miss. An AI anomaly detection system would recognize this as an unusual pattern and generate an early warning, enabling the team to take proactive measures to prevent a defective batch. This capability significantly enhances quality control by detecting deviations from desired specifications, reducing the risk of defective products and ensuring compliance.
4.2. Predictive Maintenance for Critical Assets
Unplanned downtime is one of the most significant costs in industrial manufacturing. Traditional maintenance strategies are either reactive ("fix-it-when-it-breaks") or time-based (e.g., changing a pump every six months, regardless of its condition). Predictive maintenance, powered by ML models, provides a far superior alternative.
By continuously analyzing real-time data from sensors (e.g., vibration, temperature, pressure), these models can identify early signs of equipment degradation and forecast potential failure. The system can provide a "time-to-failure forecast," allowing the team to schedule repairs during a planned shutdown weeks or even months in advance. This eliminates the costly downtime of an unexpected failure and allows for better planning of workforce, parts, and logistics. The return on investment (ROI) for this approach is substantial and well-documented in case studies. For instance, a refiner achieved a 3X ROI by implementing a proactive inspection program, while an oil and gas company saved millions of dollars with an early-warning system that detected equipment anomalies. These tangible financial benefits make the case for transitioning from a reactive to a predictive maintenance strategy.
4.3. Predictive Quality Control
Predictive quality control fundamentally changes the role of quality assurance from a post-production check to a proactive, in-process function. Instead of waiting for a final product to be tested for properties like hardness or tensile strength, ML models can continuously analyze real-time process data from all sensors to predict, with a high degree of confidence, what the final quality attributes will be.
A predictive quality model can identify the complex interplay between raw material quality, process parameters, and environmental conditions to determine the optimal production settings for a desired outcome. If the model predicts that the final product will be out of spec (e.g., too soft), it can alert the operator or even automatically adjust a process parameter (e.g., catalyst feed rate) to correct the deviation in real-time. This capability not only helps to prevent defects before they occur but also accelerates research and development by providing faster predictions of properties and identifying underlying patterns in the data. This approach is a strategic imperative for manufacturers seeking to maximize yield and improve operational efficiency.
V. Technical Implementation Roadmap
Implementing these advanced solutions requires a structured, phased approach that addresses the complexities of data integration and legacy infrastructure. A well-defined roadmap is essential for mitigating risk and demonstrating early return on investment (ROI).
5.1. Phased Approach to Digital Transformation
A successful digital transformation journey should not begin with a full-scale overhaul. The high initial investment costs and complexity of integrating new systems can be prohibitive, especially for small to medium-sized enterprises. A more effective approach is to adopt a staged implementation, starting with a Proof of Concept (PoC) on a single pilot production line. This low-risk, small-scale project allows a company to test the interoperability of new sensors and software with existing infrastructure and to evaluate performance before committing to a wider rollout. The quantified ROI from this initial success can then be used to build a compelling business case for broader implementation. This approach aligns with the core principles of Industry 4.0, which emphasize interoperability, real-time capability, and modularity.
5.2. Data Management and Integration Architecture
A robust data infrastructure is the foundation for all predictive and AI-driven solutions. The data architecture must be capable of handling the massive volume and diverse types of data generated by a smart factory. This typically involves a layered approach that includes a data historian and a data lake.
Data Historian: A data historian is a specialized database designed to collect, store, and manage vast quantities of time-series data from industrial processes. It serves as a meticulously organized digital archive, capturing every temperature fluctuation, pressure reading, and flow rate with a precise timestamp. The data historian is the optimal tool for handling the high-volume, continuous data streams from process sensors and is the "perfect fuel" for advanced analytics.
Data Lake: A data lake is a central repository that holds raw data in its native format and can accommodate diverse data types, including structured time-series data, unstructured images from quality cameras, and machine logs. The data lake is designed to handle the massive amounts of diverse data from all corners of an enterprise, enabling a more holistic, end-to-end view. A successful implementation requires both a data historian for core process data and a data lake for a broader, comprehensive view that enables complex analytics like root cause analysis and correlation with non-sensor data.
A logical layered architecture for data integration would look as follows:
|
Layer |
Component |
Function |
Data Type |
|
Edge |
IoT Sensors, Gateways, PLCs |
Real-time data acquisition and local processing |
Time-series, binary, discrete |
|
Data Foundation |
Data Historian |
High-performance, time-stamped storage of process data |
Structured time-series |
|
Central Repository |
Data Lake |
Centralized, scalable repository for all data sources |
Structured, semi-structured, unstructured |
|
Analytics & AI |
Analytics Platform |
Runs predictive models, machine learning, and business intelligence |
All data types |
Table 5.1: Key Data Integration and Management Components
5.3. Addressing Legacy System Integration Challenges
Many chemical plants still rely on operational technology (OT) systems that are over a decade old, which often use proprietary protocols that are incompatible with modern standards. Replacing these legacy systems, such as Distributed Control Systems (DCS) or Programmable Logic Controllers (PLC), is a multi-million dollar project that can cause significant production downtime. A more practical and cost-effective solution is to use IoT gateways and APIs as a bridge.
IoT gateways act as intermediaries, translating data from new IoT sensors into a format that older systems can understand. They enable a company to implement advanced monitoring without a full-scale overhaul, directly addressing the cost barrier and making the proposed solutions far more accessible. Additionally, implementing edge computing, where data is processed directly at the source, can reduce network bandwidth and improve real-time responsiveness.
5.4. On-Premise vs. Cloud Architecture Decision
The decision of where to host data and analytics platforms is a critical one with significant implications for cost, security, and scalability. The choice is not a simple "either/or" but should be based on a careful analysis of the specific use cases.
|
Criterion |
On-Premise |
Cloud |
|
Control |
Full control over hardware, software, and security. Ideal for highly regulated industries. |
Less direct control; a shared responsibility model. |
|
Cost |
High initial hardware costs; depreciation and maintenance are the company's responsibility. |
Lower initial cost with a "pay-for-what-you-use" model. |
|
Scalability |
Limited elasticity; requires manual provisioning and capital investment to scale up. |
Immense scalability and elasticity; can scale up and down dynamically. |
|
Latency |
Low latency, as data is physically close to the source. |
Can have excessive latency for some real-time control workloads. |
|
Innovation |
Slower access to new technologies; requires manual software and hardware updates. |
Rapidly expanding feature set with innovations like AI and ML. |
|
Security |
The enterprise has sole responsibility for all security practices. |
Shared responsibility with the provider, who handles many security layers. |
Table 5.2: Cloud vs. On-Premise Decision Matrix
A successful digital strategy often uses a hybrid model. Mission-critical, low-latency control loops and highly proprietary formulation data can be kept on-premise for maximum security and control. Concurrently, a cloud-based platform can be used for a centralized data lake, enabling long-term historical analysis, collaborative research with external partners, and access to cutting-edge AI and ML tools.
VI. Practical Optimization & Diagnostic Manual
The true value of advanced monitoring and modeling is realized when they are used to create actionable tools for production managers and engineers. These tools can automate and enhance the decision-making process, moving from reactive troubleshooting to proactive, model-driven control.
6.1. A Model-Driven Diagnostic Framework
In a traditional manufacturing environment, troubleshooting a defect is a time-consuming, manual process that relies on an operator's experience and a trial-and-error approach. A model-driven diagnostic framework automates this process by using real-time data and model outputs to instantly identify the most probable root cause of a problem.
The framework functions as a decision tree or logical flow chart. When a defect symptom is detected (e.g., an abnormal viscosity reading from an inline viscometer), the system automatically correlates this symptom with data from other sensors (e.g., temperature, NCO/OH ratio) and the outputs of the predictive models (e.g., the RSM model for hardness). The system can then present a prioritized list of potential root causes to the operator, reducing the diagnosis time from hours to minutes and enabling a much faster corrective action. This approach moves from simply finding a defect to proactively identifying and correcting the underlying problem.
Figure 6.1: A simplified flow chart illustrating the process of using real-time sensor data and predictive models to guide operators toward a specific root cause and a corrective action.
This approach can be summarized in a diagnostic matrix that provides a quick-reference guide for the target audience.
|
Defect/Symptom |
Relevant Data Stream |
Probable Root Cause |
|
Inconsistent Hardness |
NCO/OH ratio, Temperature profile |
Incorrect material ratio, non-uniform temperature profile |
|
Poor Adhesion |
Surface temperature, Humidity |
Improper surface preparation, environmental moisture interference |
|
Bubbles or Blemishes |
Viscosity profile, Temperature |
Volatile components, improper mixing or heat profile |
|
Inconsistent Cure Time |
NCO/OH ratio, Temperature, Catalyst feed rate |
Incorrect catalyst concentration, temperature fluctuation |
|
Weakened Structure |
Gelation time, Viscosity profile |
Insufficient heat, localized shrinkage over a cool area |
Table 6.2: Defect-to-Insight Diagnostic Matrix
6.2. Smart Standard Operating Procedures (SOPs)
Traditional Standard Operating Procedures (SOPs) are static, paper-based documents that provide a rigid, step-by-step guide for manufacturing processes. While they are essential for standardizing operations and ensuring compliance, they are unable to account for real-time process deviations. A "smart SOP" is a new, dynamic generation of procedure that is integrated with live process data.
For example, a traditional SOP for a mixing process might specify a constant temperature and mixing time. A smart SOP, on the other hand, would be linked to the real-time temperature and viscosity sensors. If a sensor detects that the ambient temperature has dropped, the smart SOP could dynamically adjust the required mixing time or temperature to compensate for the change, ensuring the final product quality remains consistent. This makes the SOP a living, adaptive document that helps operators make the optimal decision in a fluid, real-time environment, minimizing variability, reducing errors, and improving overall efficiency.
6.3. Optimization of Control Loops
The full value of the sensors and predictive models is unlocked when they are integrated into a system that actively controls the process. This involves applying best practices for tuning control loops and implementing advanced control strategies.
Control loop optimization is a systematic process that begins with a deep understanding of the process, defining the control objective, and then using real-time data to tune the loop. Advanced Process Control (APC) strategies, such as cascade and feed-forward control, can be used to improve stability and responsiveness. The ultimate goal is to close the data-to-action cycle: an inline NIR sensor provides real-time data on the NCO/OH ratio, a predictive model forecasts the outcome, and the control loop uses this information to automatically adjust the isocyanate feed pump, maintaining the optimal ratio and eliminating variability. Continuous monitoring of loop performance is crucial to catch drift, identify sensor issues, and determine when to retune before process performance degrades.
VII. Case Studies & Best Practices
The benefits of advanced monitoring and quantitative modeling are not merely theoretical; they are validated by real-world successes and quantifiable ROI. The experiences of industry leaders provide valuable lessons and a compelling business case for digitalization.
7.1. Lessons from Industry Leaders
The digitalization efforts of major chemical companies demonstrate a clear trend: success comes from a holistic, end-to-end strategy, not a piecemeal approach.
DuPont: Recognized the need for a resilient supply chain in a volatile market and implemented a customized digital platform for "what-if" scenario modeling. This enabled them to make smarter business decisions and effectively distribute over 1,000 products with enhanced prediction capabilities. The lesson is that connecting disparate systems—from the supply chain to operations—to a centralized platform provides a comprehensive view of the entire value chain.
Covestro: Launched a global corporate digitalization strategy to create a centralized "single source of truth" for project data, moving away from a dependence on spreadsheets. This integrated approach saved 90% of the time previously spent on manual data collection and validation, and it significantly increased reliability. The company also leveraged digitalization to develop new products faster and increase product quality and manufacturing profitability.
SABIC: Deployed a company-wide Digital Operations Platform that integrates raw material quality, process parameters, and environmental conditions into digital predictive tools. An AI-powered asset healthcare solution, for instance, operates across its plants globally, predicting potential failures of critical equipment and enabling proactive maintenance. This holistic approach has driven improvements in energy efficiency, asset reliability, and operational footprint.
7.2. ROI and Tangible Benefits
The investment in these technologies is a strategic business decision with a clear and substantial return. Case studies from various industries provide a compelling validation of the financial and operational benefits.
Predictive Analytics: The AVEVA Predictive Analytics software has been shown to achieve up to a $37 million efficiency savings within 24 months, with a 10% reduction in recurring maintenance costs and the elimination of 3,000 annual maintenance hours. An oil and gas company saved $33 million by using a cloud-enabled early-warning system to detect equipment anomalies. A refiner's program yielded a 3X ROI and safely reduced the number of corrosion monitoring locations by 27.4%.
Efficiency Improvements: A specialty chemical manufacturer faced challenges in reducing operating costs and enhancing production predictability. By implementing a comprehensive analysis to pinpoint improvement opportunities, they achieved a significant 2.7:1 ROI, with improvements in raw material unit yield and a boost in unit production.
Safety and Logistics: A gas plant was able to decrease evacuation and muster times by 70% through automation after repeatedly failing safety audits. SABIC's digital platform automated manual documentation processes, which previously took four days, reducing the time to just one day, eliminating major bottlenecks, and avoiding demurrage fees.
These results demonstrate that the proposed strategies are not an abstract concept but a proven, quantifiable path to achieving greater profitability, efficiency, and safety.
7.3. Theoretical Case Study: Optimizing NCO/OH Ratio
This final case study illustrates how the concepts presented throughout this report can be applied in a single, coherent narrative to solve a common, costly problem in PU production.
Scenario: A PU coatings manufacturer is experiencing batch-to-batch inconsistencies in final product hardness and cure time. Traditional lab tests are too slow to diagnose the problem in time to save the batch, leading to significant material waste. The team suspects that a fluctuating NCO/OH ratio is the root cause.
Solution:
Real-Time Monitoring: The team installs a real-time NIR spectroscopy sensor in the feed line to continuously monitor the NCO/OH ratio.2 The data from this sensor is streamed to a data historian, providing a continuous, accurate record of this critical parameter.
Quantitative Modeling: Using the historical NIR data, the team develops an RSM model that establishes the precise relationship between the NCO/OH ratio and the final product's hardness and cure time. This model allows them to determine the optimal ratio to achieve the desired properties and to predict the final quality of a batch while it is still in the reactor.
AI-Driven Anomaly Detection: An AI anomaly detection model is deployed on the data stream from the NIR sensor. The model learns the normal operating profile for the NCO/OH ratio. If it detects a deviation from this learned pattern—even a small, gradual drift—it sends an early warning to the production team. This provides an alert weeks before a problem would have been detected by traditional lab sampling.
Automated Process Control: The ultimate step is to close the loop. A predictive control system is implemented that uses the real-time data from the NIR sensor to automatically adjust the feed pump for the isocyanate. This eliminates the human factor and ensures that the NCO/OH ratio is maintained at the optimal value throughout the reaction, eliminating variability and guaranteeing consistent quality.
By applying this comprehensive framework, the manufacturer can move from a reactive, defect-driven production model to a proactive, data-driven one, ensuring every batch meets quality standards, reducing waste, and improving overall profitability.
Post time: Sep-08-2025


