

A concentration meter does not measure concentration. It measures a physical property — density, refractive index, conductivity, or sound velocity — and then translates that property into a concentration using a conversion table. Everything that can go wrong in chemical concentration measurement happens in that translation step, not in the sensor.
That is why two identical chemical streams can need completely different concentration instruments. A clean 25–50% NaOH stream converts from density without drama. A 90–98% H₂SO₄ stream also converts cleanly — but its density curve is flat near 98%, so small density errors become large concentration errors. And a mixed acid stream with two solutes cannot be converted from density at all, no matter how accurate the sensor is.
The working principle to keep in mind: the conversion curve is part of the instrument. Selecting a concentration meter means selecting the right physical property, the right conversion table, and the right operating range of that curve — not just picking a sensor with a good accuracy spec.
The conversion curve decides your real accuracy
Every density-to-concentration relationship has a slope, and the slope determines how much concentration accuracy you get from a given density accuracy. The rule: divide the density error by the curve slope at your operating point to get the concentration error.
Real numbers make this concrete. For caustic soda near 30% NaOH, the curve slope is roughly 0.010 g/cm³ per percent — so a ±0.001 g/cm³ density accuracy delivers about ±0.1% NaOH. For sulfuric acid near 98%, the slope flattens to roughly 0.002 g/cm³ per percent — the same density accuracy now delivers only ±0.5% H₂SO₄, and near 98.5% the curve flattens further. The meter did not get worse; the curve did.
| Practical slope values for common chemical streams
NaOH 10–50%: ~0.008–0.011 g/cm³ per % → density works well H₂SO₄ 90–98%: ~0.002–0.005 g/cm³ per % → verify needed accuracy H₂SO₄ < 30%: ~0.006–0.010 g/cm³ per % → density works well HCl 10–37%: ~0.004–0.006 g/cm³ per % → moderate sensitivity NaCl brine 5–26%: ~0.007 g/cm³ per % → density works well HNO₃ 30–70%: ~0.005–0.008 g/cm³ per % → density works well
Check the slope at YOUR operating point before choosing the meter accuracy class. A ±0.001 g/cm³ meter is overkill where the curve slope is steep, and insufficient where the curve is flat (concentrated H₂SO₄, near-saturation brines). |
When density alone cannot deliver the concentration
Three situations force the plant beyond a single density measurement:
1. The curve is too flat. Near 98% H₂SO₄, or in high-concentration regions of many systems, the density change per percent of concentration becomes smaller than the meter’s own resolution. No amount of sensor accuracy recovers the lost slope. Options: shift the measurement to a property with a steeper curve in that range (sound velocity, refractive index), or accept the reduced resolution and control against a different variable.
2. Two solutes are present. Density sums all dissolved species. A mixed acid bath containing both H₂SO₄ and HNO₃ at unknown proportions cannot be resolved from density — infinitely many combinations give the same density. The fix is a second independent measurement: density plus conductivity, or density plus refractive index, solved as two equations in two unknowns, with the calibration built from plant samples of the actual mixture.
3. Trace-level analytes matter. Below roughly 0.1–1 g/L, most solutes shift density by less than 0.001 g/cm³ — below the resolution of practical inline density meters. A catalyst at 50 ppm, or a residual contaminant at 100 ppm, cannot be tracked by density. These duties belong to analyzers (titration, ion-selective electrodes, spectroscopy), not to density instruments.
Choosing the physical property for the chemical stream
| Property | Strong for | Watch out for |
| Density (tuning fork) | NaOH, H₂SO₄ <90%, HNO₃, brines, solvents | Flat curve near azeotrope/saturation; multi-solute streams; solids and bubbles |
| Conductivity | Dilute acid/base, salt traces, rinse water quality | Non-monotonic at high concentration (H₂SO₄ peak ~30%); measures all ions; electrode fouling |
| Refractive index | Organic solutions, polymer solids, sugar-like systems | Prism fouling; cloudy/opalescent fluids; bubbles on prism |
| Ultrasonic (sound velocity) | High-concentration H₂SO₄, some acids where density is flat | Gas bubbles disturb propagation; temperature sensitivity; solids above ~50% disrupt signal |
Temperature: the difference between a number and a fact
Concentration tables are temperature-referenced. The table says “at 20°C, this density means 30% NaOH.” If the process runs at 60°C and the meter does not compensate, the raw density at 60°C is lower than the same solution at 20°C — and the uncompensated meter reports a lower concentration than reality. The error can be several percent for hot concentrated streams.
Compensation is built into modern meters, but its quality depends on two things the plant controls. First, the coefficient must be correct for the specific fluid at the specific concentration range — the thermal expansion coefficient of 30% NaOH differs from that of 10% NaOH. Second, the temperature element must see the true fluid temperature, which means good thermal contact and no stagnant pocket around the sensor. A meter whose compensation is configured with the wrong coefficient is worse than no compensation, because it reports a confident wrong number.
Three chemical stations where online concentration pays
Acid dilution and blending. Diluting 98% H₂SO₄ to a working strength is exothermic and hazardous. An online concentration meter at the diluter outlet closes the loop, holding strength within spec continuously instead of waiting for the next lab round. The measurement also protects downstream equipment from over-strength acid.
Caustic preparation and dosing. Membrane-cell and diaphragm-cell caustic both finish at specification strength. Online NaOH concentration at the evaporator or dilution station verifies the product before it goes to storage — and in dosing applications, keeps the dosed strength constant regardless of tank level stratification.
Wash water and rinse monitoring. Ion-exchange regeneration, scrubber liquor, and rinse circuits need to know when a wash is spent or a breakthrough is starting. Conductivity-based concentration measurement gives the continuous signal that batch sampling misses, triggering regeneration or alarm at the right moment.
In all three, the economic case is not the meter — it is the off-spec production, the safety event, or the wasted reagent that continuous measurement prevents.
LONNMETER concentration systems for chemical plants
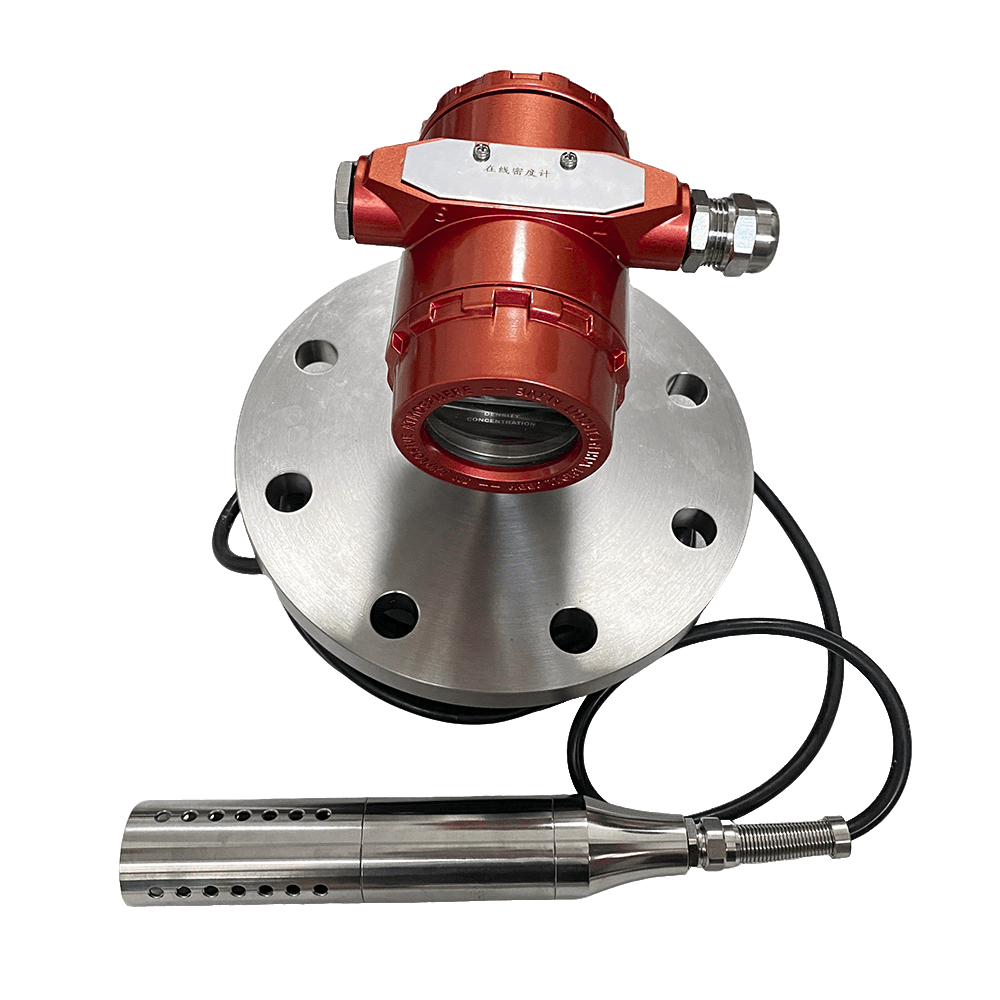
LONNMETER supplies density-based concentration systems on the LONN-700S platform with pre-loaded conversion tables for the common chemical streams — NaOH, H₂SO₄ (both dilute and concentrated ranges), HCl, HNO₃, NaCl brine — in wetted materials from 316L to Hastelloy C-276, tantalum, and PTFE-lined versions. For streams where density is ambiguous or flat, we configure density-plus-conductivity dual-sensor systems with two-parameter calibration built from your plant samples.
The specification conversation starts with four questions: the solute, the operating range, the temperature, and what you will do with the reading. The answers decide the property, the table, and the accuracy class — and whether a single density meter is the honest answer at all.
Common questions on chemical concentration measurement
Why is my H₂SO₄ concentration reading less accurate at 98% than at 50%?
Because the density-concentration curve flattens as you approach the maximum density of H₂SO₄ (around 98.3%, where density peaks near 1.84 g/cm³). Near the peak, a large concentration change produces only a small density change — the same ±0.001 g/cm³ density error that gives ±0.1% NaOH near 30% may give ±0.5% or worse near 98% H₂SO₄. This is a property of the chemistry, not a defect of the meter. For concentrated acid, consider sound-velocity measurement, which keeps a steeper slope in that region, or tighten the control band around a fixed operating point.
Can one concentration meter measure both NaOH and H₂SO₄?
Yes, if the instrument stores multiple conversion tables and can switch between them — by recipe, by tag, or by manual selection — without recalibration. The hardware is the same; the table defines the measurement. Confirm the instrument supports multi-table storage and the switch-over procedure before buying. If you use the meter in a line that alternates between acid and caustic, also confirm the wetted materials survive both services, since material compatibility windows differ.
What is the lowest concentration a density-based meter can measure?
Roughly 0.1–1 g/L for most solutes, depending on the solute’s density contribution. Below that, the density shift falls below the practical resolution of inline tuning fork meters (about ±0.0005–0.001 g/cm³ in good installations). At 0.1 g/L of a typical salt, the density shift is on the order of 0.0001 g/cm³ — unrecoverable. For trace analysis below this threshold, use conductivity (for ionic species), ion-selective electrodes, or lab analysis. Match the technology to the concentration decade.
How do I handle a mixed acid bath with two acids?
A single density meter cannot resolve two unknowns. Install two independent measurements — for example density plus conductivity, or density plus refractive index — and build a two-parameter calibration from at least ten plant samples covering the operating envelope. The calibration solves two equations in two unknowns. Validate the model quarterly against lab analysis, because the relationship drifts as bath contamination accumulates. If only one parameter is feasible, treat the reading as a trend indicator and confirm with periodic lab titration.
How often must I recalibrate a chemical concentration meter?
Start monthly: verify the physical property reading (density against demineralized water at 20°C; conductivity against a standard KCl solution) and compare the concentration output against a lab measurement of a grab sample. Watch the diagnostic frequency trend for early signs of coating or corrosion. Recalibrate when verification exceeds your tolerance, after any sensor cleaning, and after any change in the process chemistry — a new raw material batch alone can shift the conversion relationship. In aggressive chemical service, quarterly full recalibration is a reasonable default until drift data justifies otherwise.
Post time: Sep-20-2026


