

A concentration meter is two instruments in one. The first is the physical property sensor — density, refractive index, conductivity, or sound velocity. The second is the conversion table that maps that physical property to a concentration value. Troubleshooting a concentration meter means troubleshooting both, and the conversion table side is where most problems actually live.
Before starting the symptom check, confirm two things: what is the correct physical property for the process fluid at the operating concentration, and what is the correct reference temperature for the conversion table? Getting those two things wrong first guarantees a wrong concentration reading regardless of the sensor condition.
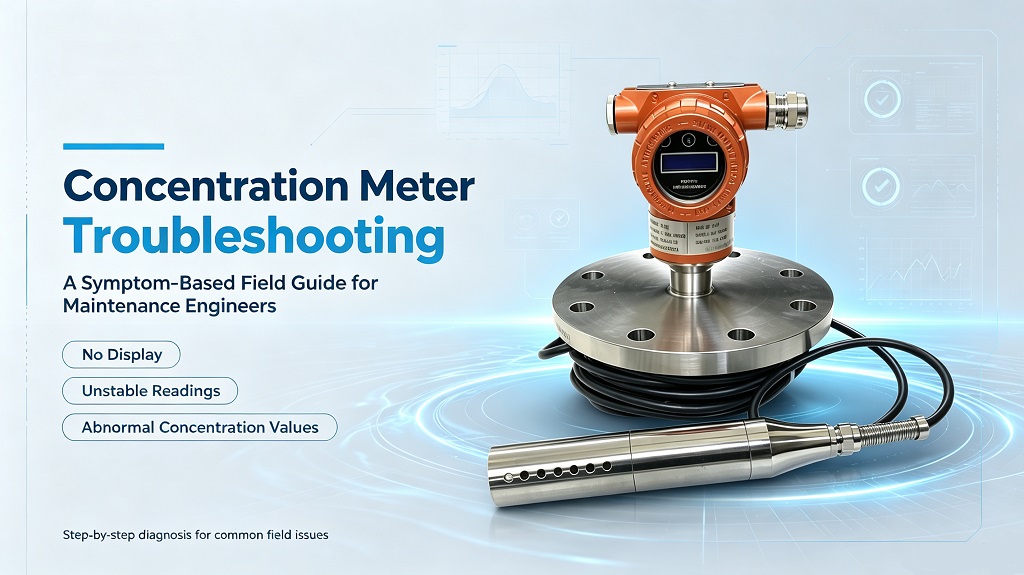
Symptom 1: Concentration reading is consistently wrong
Cause 1: Wrong or outdated conversion table.
This is the most common cause of wrong concentration readings and the first thing to check. The conversion table must match the specific solute. The sucrose Brix table does not apply to HFCS. The NaCl table does not apply to KCl. The H₂SO₄ table for heap leaching (0.5–10 g/L) is not the same as the H₂SO₄ table for acid concentration (90–98%).
Check: Confirm the conversion table name and version loaded in the instrument. Confirm that it matches the specific solute and the specific concentration range of your process. If the solute or concentration range has changed, the table must be updated.
Cause 2: Reference temperature mismatch.
The conversion table is referenced to a specific temperature — typically 20°C or 15°C. If the meter is outputting concentration referenced to 20°C but the lab measured at 25°C, there will be a discrepancy because the density-to-concentration relationship is temperature-dependent.
Check: Confirm the reference temperature setting in the instrument matches the reference temperature of the conversion table. Verify that the lab measurement was corrected to the same reference temperature. For petroleum products, the API standard is 15°C. For food products (ICUMSA), the standard is 20°C. A 5°C reference temperature mismatch can produce a concentration error of 0.2–0.5% for typical aqueous solutions.
Cause 3: Sensor calibration drift.
The physical property sensor (density, refractive index, conductivity, or sound velocity) has drifted over time. The drift is small for most sensors, but it can accumulate to a measurable error in the concentration calculation.
Check: Verify the physical property reading against a known reference. For density-based concentration meters: verify with demineralized water (0.9982 g/cm³ at 20°C). For conductivity meters: verify with a standard KCl solution. For refractometers: verify with demineralized water (nD = 1.3330 at 20°C). If the physical property reading is off, recalibrate the sensor.
Cause 4: Temperature compensation not applied or incorrectly configured.
If temperature compensation is disabled or set to the wrong coefficient, the concentration output will drift with temperature even if the concentration is actually constant.
Check: Confirm that temperature compensation is enabled. Confirm that the temperature sensor is reading correctly (compare to an independent thermometer at the process line). Confirm the compensation coefficient matches the fluid.
| Concentration reading wrong: diagnostic checklist
☐ Conversion table: Is the correct table loaded for the specific solute? ☐ Reference temperature: Does the instrument ref temp match the table ref temp? ☐ Physical property: Verify density, RI, or conductivity against a known reference. ☐ Temperature compensation: Is it enabled? Is the T-sensor reading correctly? ☐ Secondary solute: Is there a second solute affecting the measurement?
Quick cross-check: Calculate the expected density for the reported concentration. Compare to the actual density reading. If they match, the sensor is working. If they don’t match, the conversion table or compensation is the problem. |
Symptom 2: Concentration reading fluctuates
Cause 1: Temperature oscillation.
The most common cause of concentration fluctuation. Even with temperature compensation, a rapidly oscillating temperature will cause oscillation in the concentration output if the compensation time constant is too long. A 1°C oscillation with a 60-second compensation time constant will produce a concentration oscillation.
Check: Monitor the temperature signal. If it is oscillating, fix the temperature control upstream. If the temperature is stable but the concentration is still fluctuating, the issue is in the physical property measurement, not temperature.
Cause 2: Bubbles in the refractive index or density sensor.
For refractometers, any bubble on the prism surface produces an erroneous refractive index reading. For density-based meters, bubbles produce an apparent density reduction. Bubbles can form when the process pressure drops below the dissolved gas liberation pressure.
Check: Is there a pressure drop or valve upstream of the sensor? Increase the pressure at the sensor by raising the process level or moving the sampling point. For refractometers, check the prism for bubbles and clean if needed.
Cause 3: Concentration genuinely oscillating.
The meter might be correct. If the feed composition or the blending rate is fluctuating, the concentration will fluctuate. The instrument is measuring what is actually there.
Check: Take a physical sample and measure concentration in the lab. If the lab measurement is also fluctuating, the process concentration is genuinely oscillating and the meter is working correctly.
Symptom 3: Conductivity-based concentration reading is wrong
Cause 1: Conductivity is not monotonic with concentration.
For many electrolyte solutions, conductivity goes through a maximum at intermediate concentrations and decreases at higher concentrations. This is particularly true for H₂SO₄: at low concentrations (<10 g/L), conductivity increases with concentration; at high concentrations (>30 g/L), conductivity decreases with increasing concentration because the ionic mobility decreases. If the conversion table is defined for the wrong concentration range, the output will be wrong.
Check: Confirm that the conductivity-to-concentration table covers the actual operating range. If the process concentration straddles the conductivity maximum, conductivity alone cannot uniquely determine concentration. Use a second parameter (density) to resolve the ambiguity.
Cause 2: Conductivity electrode fouling.
Conductive coatings on the electrode surface reduce the effective electrode area, reducing the measured conductivity. Fouling is common in brines with scale-forming ions (Ca, Mg) or in biological fluids.
Check: Remove the sensor and inspect the electrodes. Clean with dilute acid (for scale) or appropriate solvent (for organic fouling). After cleaning, verify with a standard KCl solution.
Cause 3: Temperature compensation coefficient wrong.
Conductivity temperature coefficient is typically 1.5–2.5% per °C for aqueous solutions, but it varies by electrolyte. If the coefficient is set to the wrong value, the temperature-compensated conductivity will be wrong.
Cause 4: Second electrolyte present.
Conductivity measures all ionic species in solution. If there is a second electrolyte present (e.g., NaCl and KCl together), the conductivity reading reflects the sum of both contributions, and a calibration for a single electrolyte will overestimate the concentration.
| Conductivity concentration reading wrong: quick check
Step 1: Is the conductivity reading within the table’s defined range? Step 2: Is the temperature compensation coefficient correct for this electrolyte? Step 3: Is the electrode clean? Verify with standard KCl solution. Step 4: Are there multiple ionic species present? If yes: single-parameter conductivity measurement is insufficient. Add density as second parameter for two-parameter correlation.
H₂SO₄ special case: conductivity is NOT monotonic across all concentrations. Confirm your operating range is on the correct side of the conductivity maximum. |
Symptom 4: Inline refractometer reading is wrong or unstable
Cause 1: Prism contamination.
The most common refractometer failure. A film of oil, fat, sugar, or protein on the prism surface produces a lower refractive index reading than the actual process fluid.
Check: Inspect the prism through the viewing window (where applicable). Clean with demineralized water followed by isopropyl alcohol. Do not use abrasive materials. After cleaning, verify against a reference standard or demineralized water (nD = 1.3330 at 20°C).
Cause 2: Bubbles or foam on the prism.
Even clean bubbles on the prism surface produce an incorrect reading because the bubble has a refractive index of approximately 1.0 (air) rather than the process fluid.
Cause 3: Opalescence or suspended solids.
If the fluid is cloudy, opalescent, or contains suspended particles, the refractive index reading is unreliable because the optical path is scattered.
Check: Check if the process fluid is clear. If it is cloudy, opaque, or contains suspended matter, switch to a density-based concentration measurement instead of refractometry.
Cause 4: Refractive index out of range.
Every refractometer has a maximum refractive index range. If the fluid refractive index exceeds the sensor range, the output will be wrong or stuck at the maximum.
Preventive maintenance schedule by principle
| Principle | Monthly | Quarterly | Semi-Annual | Key Tasks |
| Density (tuning fork) | Verify vs water std | Clean sensor, check wiring | Full calibration | Verify conversion table version, ref temp, α coefficient |
| Refractometry | Verify vs water std | Clean prism surface | Full calibration | Check window integrity, LED source intensity |
| Conductivity | Verify vs KCl std | Clean electrodes | Check cell constant | Verify T compensation coefficient, check cable integrity |
| Ultrasonic (SV) | Compare to lab sample | Check transducer coupling | Verify SV table | Check for gas bubble interference, verify calibration fluid |
Common questions on concentration meter troubleshooting
How do I know if the conversion table is correct?
Cross-check: take a process sample, measure the physical property (density, RI, conductivity) in the lab, and look up the concentration from the conversion table. Compare to the lab concentration measurement (e.g., by titration or evaporation). If they match, the table is correct. If they don’t, the table may be for the wrong solute, the wrong temperature reference, or the wrong concentration range.
Can I use one concentration meter for two different solutions?
Physically, yes. Programmatically, only if you load the correct conversion table before each use. If you switch between two solutions regularly, the instrument must be able to store both tables and switch between them without recalibration. Some instruments support multi-table configurations. If your instrument does not, a solution switch requires recalibration and table reload each time.
Why does my conductivity meter read correctly in the lab but wrong in the process?
Three likely reasons: (1) The process temperature differs from the lab temperature and the temperature compensation is not correcting for it. (2) There is a second ionic species in the process that is not present in the lab solution. (3) The electrode is fouled in the process but clean in the lab. Check the temperature, check the electrode, and verify the solution composition.
What is the maximum suspended solids level for a refractometer?
There is no universal standard, but most inline refractometers require a clear fluid. Suspended solids above approximately 0.1% (1 g/L) will start to affect the reading. For fluids with any significant suspended solids, use a density-based concentration meter or a nuclear gauge instead of refractometry.
How often should I update the conversion table?
Update the table when: (1) the solute or concentration range changes; (2) the measurement has been verified against lab data and a consistent discrepancy is found; (3) the instrument manufacturer releases an updated table. Standard reference tables (ICUMSA for sucrose, OIML for alcohol, API for petroleum products) are stable and do not need routine updating. Custom tables for specialty solutions should be validated against lab data annually.
Post time: Sep-03-2026


